a x 2 + b x + c = 0 , a , b , c ∈ R , a ≠ 0 a{{x}^{2}}+bx+c=0, a, b, c\in \mathbb{R}, a\ne 0 a x 2 + b x + c = 0 , a , b , c ∈ R , a = 0
Δ = b 2 − 4 a c \Delta ={{b}^{2}}-4ac Δ = b 2 − 4 a c
Solution formulas for Δ > 0 \Delta >0 Δ > 0
x 1 = − b + Δ 2 a ; x 1 = − b − Δ 2 a {{x}_{1}}=\frac{-b+\sqrt{\Delta }}{2a}; {{x}_{1}}=\frac{-b-\sqrt{\Delta }}{2a} x 1 = 2 a − b + Δ ; x 1 = 2 a − b − Δ
Solution formulas for Δ = 0 \Delta =0 Δ = 0
x 1 = x 2 = − b 2 a {{x}_{1}}={{x}_{2}}=\frac{-b}{2a} x 1 = x 2 = 2 a − b
In this case the equation a x 2 + b x + c = 0 a{{x}^{2}}+bx+c=0 a x 2 + b x + c = 0 a ( x + b 2 a ) 2 = 0 a{{\left( x+\frac{b}{2a} \right)}^{2}}=0 a ( x + 2 a b ) 2 = 0
Solution formulas for Δ < 0 \Delta <0 Δ < 0
x 1 = − b + i ∣ Δ ∣ 2 a ; x 2 = − b − i ∣ Δ ∣ 2 a {{x}_{1}}=\frac{-b+i\sqrt{\left| \Delta \right|}}{2a}; {{x}_{2}}=\frac{-b-i\sqrt{\left| \Delta \right|}}{2a} x 1 = 2 a − b + i ∣ Δ ∣ ; x 2 = 2 a − b − i ∣ Δ ∣
Viète's formulas: S = x 1 + x 2 = − b a S={{x}_{1}}+{{x}_{2}}=-\frac{b}{a} S = x 1 + x 2 = − a b ; P = x 1 ⋅ x 2 = c a P={{x}_{1}}\cdot {{x}_{2}}=\frac{c}{a} P = x 1 ⋅ x 2 = a c
Formulas useful in the study of the quadratic equation
x 1 2 + x 2 2 = ( x 1 + x 2 ) 2 − 2 x 1 x 2 = S 2 − 2 P {{x}_{1}}^{2}+{{x}_{2}}^{2}={{\left( {{x}_{1}}+{{x}_{2}} \right)}^{2}}-2{{x}_{1}}{{x}_{2}}={{S}^{2}}-2P x 1 2 + x 2 2 = ( x 1 + x 2 ) 2 − 2 x 1 x 2 = S 2 − 2 P
x 1 3 + x 2 3 = ( x 1 + x 2 ) 3 − 3 x 1 x 2 ( x 1 + x 2 ) = S 3 − 3 S P {{x}_{1}}^{3}+{{x}_{2}}^{3}={{\left( {{x}_{1}}+{{x}_{2}} \right)}^{3}}-3{{x}_{1}}{{x}_{2}}\left( {{x}_{1}}+{{x}_{2}} \right)={{S}^{3}}-3SP x 1 3 + x 2 3 = ( x 1 + x 2 ) 3 − 3 x 1 x 2 ( x 1 + x 2 ) = S 3 − 3 S P
x 1 4 + x 2 4 = ( x 1 + x 2 ) 4 − 6 x 1 2 x 2 2 − 4 x 1 x 2 ( x 1 2 + x 2 2 ) = S 4 − 4 S 2 P + 2 P 2 {{x}_{1}}^{4}+{{x}_{2}}^{4}={{\left( {{x}_{1}}+{{x}_{2}} \right)}^{4}}-6x_{1}^{2}x_{2}^{2}-4{{x}_{1}}{{x}_{2}}(x_{1}^{2}+x_{2}^{2})={{S}^{4}}-4{{S}^{2}}P+2{{P}^{2}} x 1 4 + x 2 4 = ( x 1 + x 2 ) 4 − 6 x 1 2 x 2 2 − 4 x 1 x 2 ( x 1 2 + x 2 2 ) = S 4 − 4 S 2 P + 2 P 2
The quadratic function
f : R → R , f ( x ) = a x 2 + b x + c , a , b , c ∈ R , a ≠ 0 f:\mathbb{R}\to \mathbb{R}, f(x)=a{{x}^{2}}+bx+c, a, b, c\in \mathbb{R}, a\ne 0 f : R → R , f ( x ) = a x 2 + b x + c , a , b , c ∈ R , a = 0
The graph of a quadratic function is a parabola.
This function can also be written in the form f ( x ) = a ( x + b 2 a ) 2 + − Δ 4 a f(x)=a{{\left( x+\frac{b}{2a} \right)}^{2}}+\frac{-\Delta }{4a} f ( x ) = a ( x + 2 a b ) 2 + 4 a − Δ f ( x ) = x 2 f(x)={{x}^{2}} f ( x ) = x 2 x v = − b 2 a {{x}_{v}}=-\frac{b}{2a} x v = − 2 a b y v = − Δ 4 a {{y}_{v}}=-\frac{\Delta }{4a} y v = − 4 a Δ
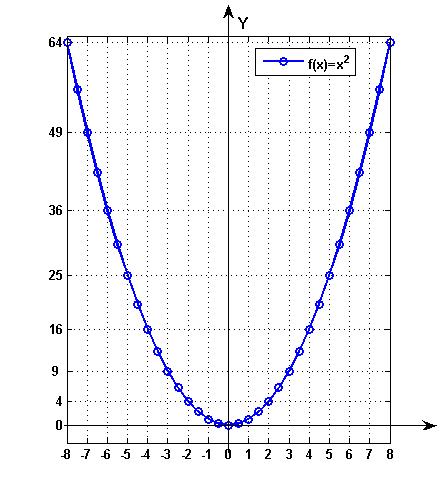
Graph of the function f ( x ) = x 2 f(x)={{x}^{2}} f ( x ) = x 2
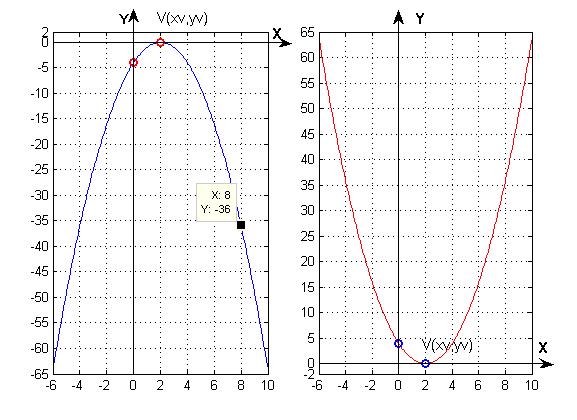
Graph of the function f ( x ) = a ( x + b 2 a ) 2 + − Δ 4 a f(x)=a{{\left( x+\frac{b}{2a} \right)}^{2}}+\frac{-\Delta }{4a} f ( x ) = a ( x + 2 a b ) 2 + 4 a − Δ
There are no three collinear points on the graph of the function f ( x ) = x 2 f(x)={{x}^{2}} f ( x ) = x 2
Three distinct points M 0 ( x 0 , y 0 ) , M 1 ( x 1 , y 1 ) , M 2 ( x 2 , y 2 ) {{M}_{0}}\left( {{x}_{0}},{{y}_{0}} \right), {{M}_{1}}\left( {{x}_{1}},{{y}_{1}} \right), {{M}_{2}}\left( {{x}_{2}},{{y}_{2}} \right) M 0 ( x 0 , y 0 ) , M 1 ( x 1 , y 1 ) , M 2 ( x 2 , y 2 ) y 2 − y 0 x 2 − x 0 = y 1 − y 0 x 1 − x 0 \frac{{{y}_{2}}-{{y}_{0}}}{{{x}_{2}}-{{x}_{0}}}=\frac{{{y}_{1}}-{{y}_{0}}}{{{x}_{1}}-{{x}_{0}}} x 2 − x 0 y 2 − y 0 = x 1 − x 0 y 1 − y 0
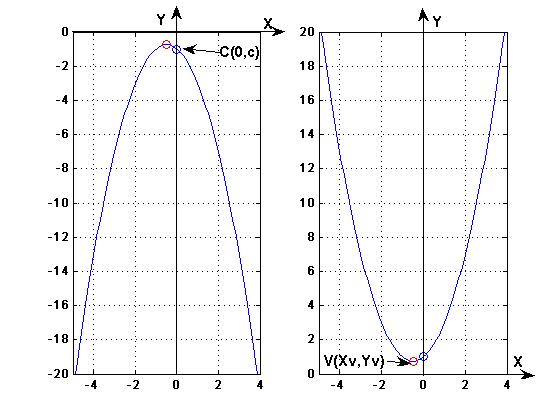
Maximum or minimum of a quadratic function
If a > 0 a>0 a > 0 f : R → R , f ( x ) = a x 2 + b x + c , a , b , c ∈ R , a ≠ 0 f:\mathbb{R}\to \mathbb{R}, f(x)=a{{x}^{2}}+bx+c, a, b, c\in \mathbb{R}, a\ne 0 f : R → R , f ( x ) = a x 2 + b x + c , a , b , c ∈ R , a = 0 − Δ 4 a -\frac{\Delta }{4a} − 4 a Δ x = − b 2 a x=-\frac{b}{2a} x = − 2 a b
If a < 0 a<0 a < 0 f ( x ) = a x 2 + b x + c f(x)=a{{x}^{2}}+bx+c f ( x ) = a x 2 + b x + c − Δ 4 a -\frac{\Delta }{4a} − 4 a Δ x = − b 2 a x=-\frac{b}{2a} x = − 2 a b
Graph of the function f ( x ) = a x 2 , a > 1 f(x)=a{{x}^{2}}, a>1 f ( x ) = a x 2 , a > 1
Graph of the function f ( x ) = a x 2 , a ∈ ( 0 , 1 ) f(x)=a{{x}^{2}}, a\in (0,1) f ( x ) = a x 2 , a ∈ ( 0 , 1 )
Graph of the function f ( x ) = a x 2 , a < − 1 f(x)=a{{x}^{2}}, a<-1 f ( x ) = a x 2 , a < − 1
Graph of the function f ( x ) = a x 2 , a ∈ ( − 1 , 0 ) f(x)=a{{x}^{2}}, a\in (-1,0) f ( x ) = a x 2 , a ∈ ( − 1 , 0 )
Sign of the quadratic function
Let f : R → R , f ( x ) = a x 2 + b x + c , a , b , c ∈ R , a ≠ 0 f:\mathbb{R}\to \mathbb{R}, f(x)=a{{x}^{2}}+bx+c, a, b, c\in \mathbb{R}, a\ne 0 f : R → R , f ( x ) = a x 2 + b x + c , a , b , c ∈ R , a = 0
If Δ = b 2 − 4 a c < 0 \Delta ={{b}^{2}}-4ac<0 Δ = b 2 − 4 a c < 0 f ( x ) f(x) f ( x ) a a a x ∈ R x\in \mathbb{R} x ∈ R
The sign table of the function is:
x x x
− ∞ -\infty − ∞
+ ∞ +\infty + ∞
f ( x ) f(x) f ( x )
sign of a a a
If Δ = b 2 − 4 a c = 0 \Delta ={{b}^{2}}-4ac=0 Δ = b 2 − 4 a c = 0 f ( x ) = 0 f(x)=0 f ( x ) = 0 x 1 = − b 2 a {{x}_{1}}=-\frac{b}{2a} x 1 = − 2 a b
The sign table of the function is:
x x x − ∞ -\infty − ∞ x 1 = − b 2 a {{x}_{1}}=-\frac{b}{2a} x 1 = − 2 a b + ∞ +\infty + ∞ f ( x ) f(x) f ( x ) sign of a a a 0 sign of a a a
If Δ = b 2 − 4 a c > 0 \Delta ={{b}^{2}}-4ac>0 Δ = b 2 − 4 a c > 0 f ( x ) = 0 f(x)=0 f ( x ) = 0 x 1 = − b + Δ 2 a {{x}_{1}}=\frac{-b+\sqrt{\Delta }}{2a} x 1 = 2 a − b + Δ x 2 = − b − Δ 2 a {{x}_{2}}=\frac{-b-\sqrt{\Delta }}{2a} x 2 = 2 a − b − Δ f ( x ) = a ⋅ ( x − x 1 ) ( x − x 2 ) f(x)=a\cdot (x-{{x}_{1}})(x-{{x}_{2}}) f ( x ) = a ⋅ ( x − x 1 ) ( x − x 2 ) .
The sign table of the function is:
x x x − ∞ -\infty − ∞ x 1 {{x}_{1}} x 1 x 2 {{x}_{2}} x 2 + ∞ +\infty + ∞ f ( x ) f(x) f ( x ) sign of a a a 0 opposite sign to a a a 0 sign of a a a
Note: the intervals ( − ∞ , − b 2 a ] i [ − b 2 a , ∞ ) \left( -\infty , \frac{-b}{2a} \right]\text{ i }\left[ \frac{-b}{2a}, \infty \right) ( − ∞ , 2 a − b ] i [ 2 a − b , ∞ ) intervals of monotonicity of the
function.
Sketching the quadratic function
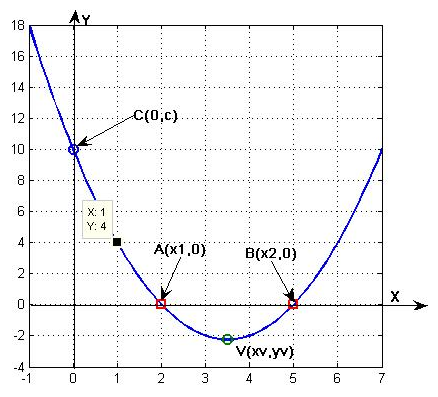
Intersections with the coordinate axes
Intersection with the O x Ox O x f ( x ) = 0 f(x)=0 f ( x ) = 0 x 1 {{x}_{1}} x 1 x 2 {{x}_{2}} x 2 A ( x 1 , 0 ) i B ( x 2 ,0) A({{x}_{1}},0)\text{ i }B\text{(}{{x}_{2}}\text{,0)} A ( x 1 , 0 ) i B ( x 2 ,0)
Intersection with the O y Oy O y f ( 0 ) f(0) f ( 0 ) C ( 0 , c ) C(0,c) C ( 0 , c )
The vertex of the parabola and the axis of symmetry
The point V ( − b 2 a , − Δ 4 a ) V\left( -\frac{b}{2a}\text{, }-\frac{\Delta }{4a} \right) V ( − 2 a b , − 4 a Δ ) vertex of
the parabola .
The axis of symmetry is the line about which every point of the parabola is
symmetric; it has the equation x = − b 2 a x=\frac{-b}{2a} x = 2 a − b
Fill in a table of values, which may include values other than those already
computed, so that the curve can be drawn as accurately as possible.
Plot the points in the rectangular system x O y xOy x O y
Factorising the trinomial f ( X ) = a X 2 + b X + c , a , b , c ∈ R , a ≠ 0 f(X)=a{{X}^{2}}+bX+c, a, b, c\in \mathbb{R}, a\ne 0 f ( X ) = a X 2 + b X + c , a , b , c ∈ R , a = 0 x 1 {{x}_{1}} x 1 x 2 {{x}_{2}} x 2
Δ > 0 \Delta >0 Δ > 0 f ( X ) = a ( X − x 1 ) ( X − x 2 ) f(X)=a(X-{{x}_{1}})(X-{{x}_{2}}) f ( X ) = a ( X − x 1 ) ( X − x 2 )
Δ = 0 \Delta =0 Δ = 0 f ( X ) = a ( X − x 1 ) 2 ; f(X)=a{{(X-{{x}_{1}})}^{2}}; f ( X ) = a ( X − x 1 ) 2 ;
Δ < 0 \Delta <0 Δ < 0 f ( X ) f(X) f ( X ) R \mathbb{R} R f ( X ) = a X 2 + b X + c . f(X)=a{{X}^{2}}+bX+c. f ( X ) = a X 2 + b X + c .
Constructing a quadratic equation when its sum S = x 1 + x 2 S={{x}_{1}}+{{x}_{2}} S = x 1 + x 2 P = x 1 ⋅ x 2 P={{x}_{1}}\cdot {{x}_{2}} P = x 1 ⋅ x 2
x 2 − S x + P = 0. {{x}^{2}}-Sx+P=0. x 2 − S x + P = 0.
Try it
The parabola. a decides which way it opens and how narrow it is, b
slides the vertex sideways, c lifts the whole curve.
Set a to 0 and it stops being a parabola at all — that is the condition the
chapter keeps insisting on.
The discriminant decides how many times the curve meets the x-axis. Move the
sliders until it touches at exactly one point — that is Δ = 0.